Skip to content

Australia

Australian suburb research for property investors

Search suburbs by yield and growth, then open a detailed investment report.

Akweno turns public and licensed Australian property data into a plain-English suburb report: what the area costs, what it rents for, how it has grown and where inside the suburb the numbers look strongest. Then you can turn it into a Buy scenario and test it against your own finances.

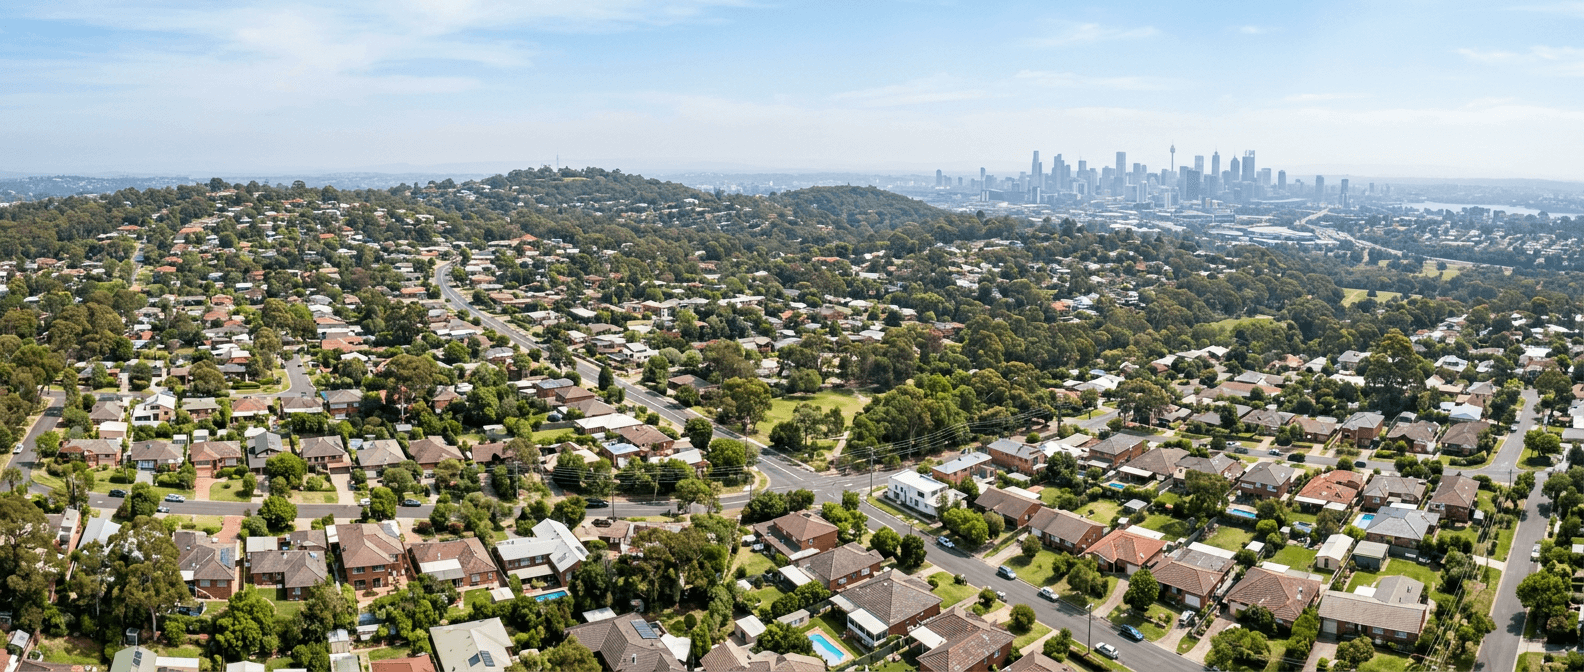
Aerial view of an Australian suburb of tree-lined streets and family homes, with a city skyline on the horizon

What you get

Everything you need to judge an Australian suburb

One suburb report brings the numbers, the area, the best pockets and the alternatives next door into a single document.

The investment numbers

Know what you would pay, what it rents for and how the price has moved.

  • Gross rental yield for houses and units
  • Median property price and weekly rent
  • Capital growth over 1, 3, 5 and 10 years
  • Vacancy, days on market and vendor discounting
The suburb itself

See what it is like to live and rent there before you visit.

  • Public transport stops and stations
  • Schools with their ACARA advantage index
  • Cafés, parks, shopping centres and a walkability score
  • Demographics, household income and tenure
  • Local jobs and a labour resilience score

The best pockets inside the suburb

A suburb is not one market. Pockets show where inside it the numbers are strongest.

  • A hexagon map of areas of about 0.7 square kilometres
  • Ranked on yield, price and risk
  • The streets and landmarks each pocket sits around

Better nearby suburbs

Compare with next door before you commit to one suburb.

  • Suburbs within 10 km that beat this one on yield or five-year growth
  • See what you gain or give up on price
  • Compare up to four saved reports side by side
Get your first report free

Saved reports re-open at no extra cost.

Suburb scans

Not sure which suburb? Run a scan.

Scan around a location, or across a region, and Akweno ranks Australian suburbs by the rental yield and growth you want. Then open a full report on the ones that stand out.

What a suburb scan does

  • Search around a location with a radius, or across a wider region
  • Rank suburbs by yield, growth or a balance of both
  • Filter by house or unit
  • Save the ranked results and revisit them any time
  • Open a detailed suburb report on any suburb in the list
  1. Discover

    Search suburbs by yield and growth, or look up a specific place, and compare the areas that fit.

  2. Investigate

    Open a detailed suburb report to see the evidence, the opportunities and the risks in one place.

  3. Evaluate

    Start a Buy scenario from the report and test the purchase against your own deposit, loan and costs.

Sample report

A real Australia report, free to read

Preview the pages below or download the full PDF. No signup needed.

Doncaster East, VIC

Suburb report · House

Download PDF

A 16-page suburb investment report: executive summary and scorecard, price history, rental market, housing mix, neighbourhood, best pockets inside the suburb, better nearby suburbs, local employment and full sources.

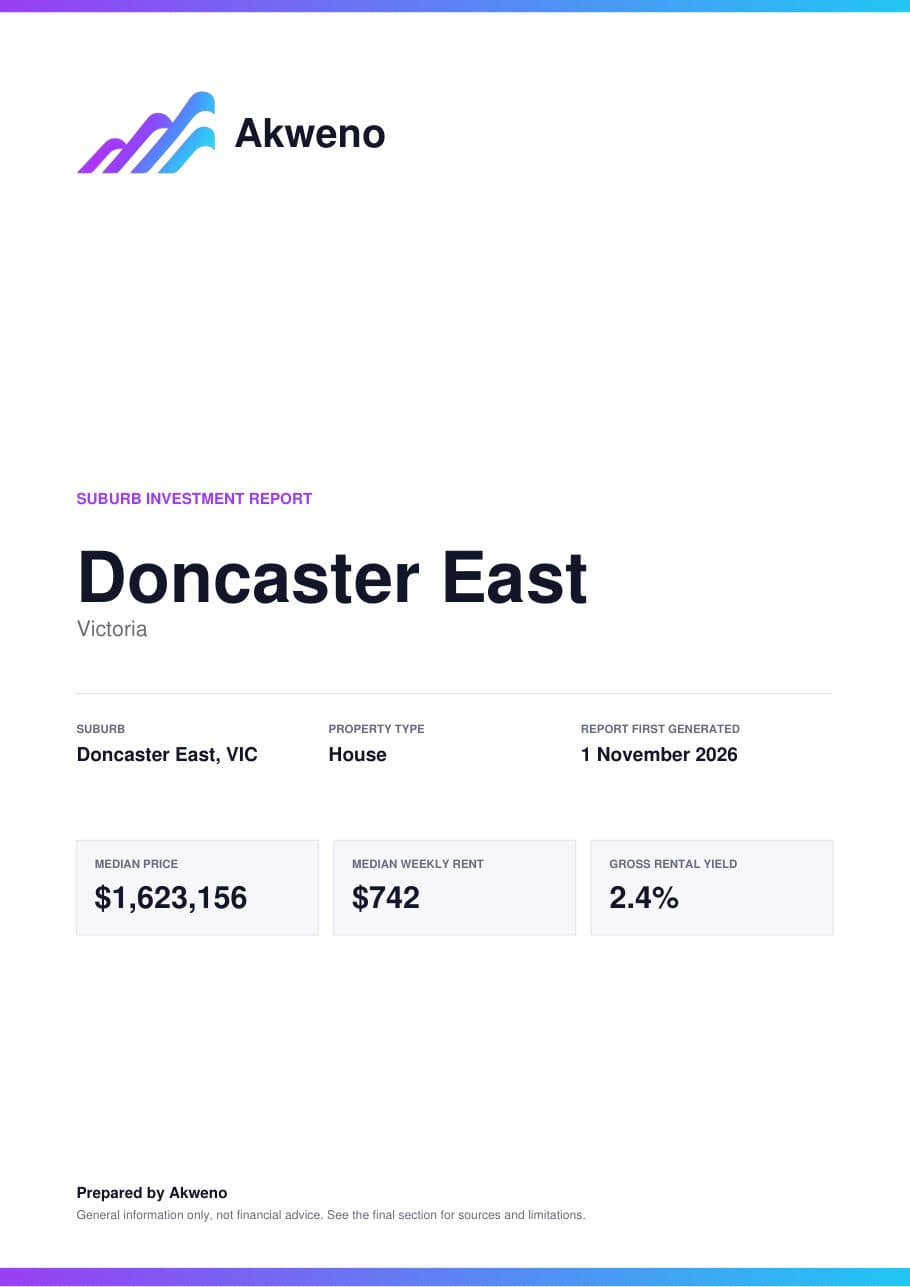
  • Cover page of the Doncaster East suburb investment reportCover
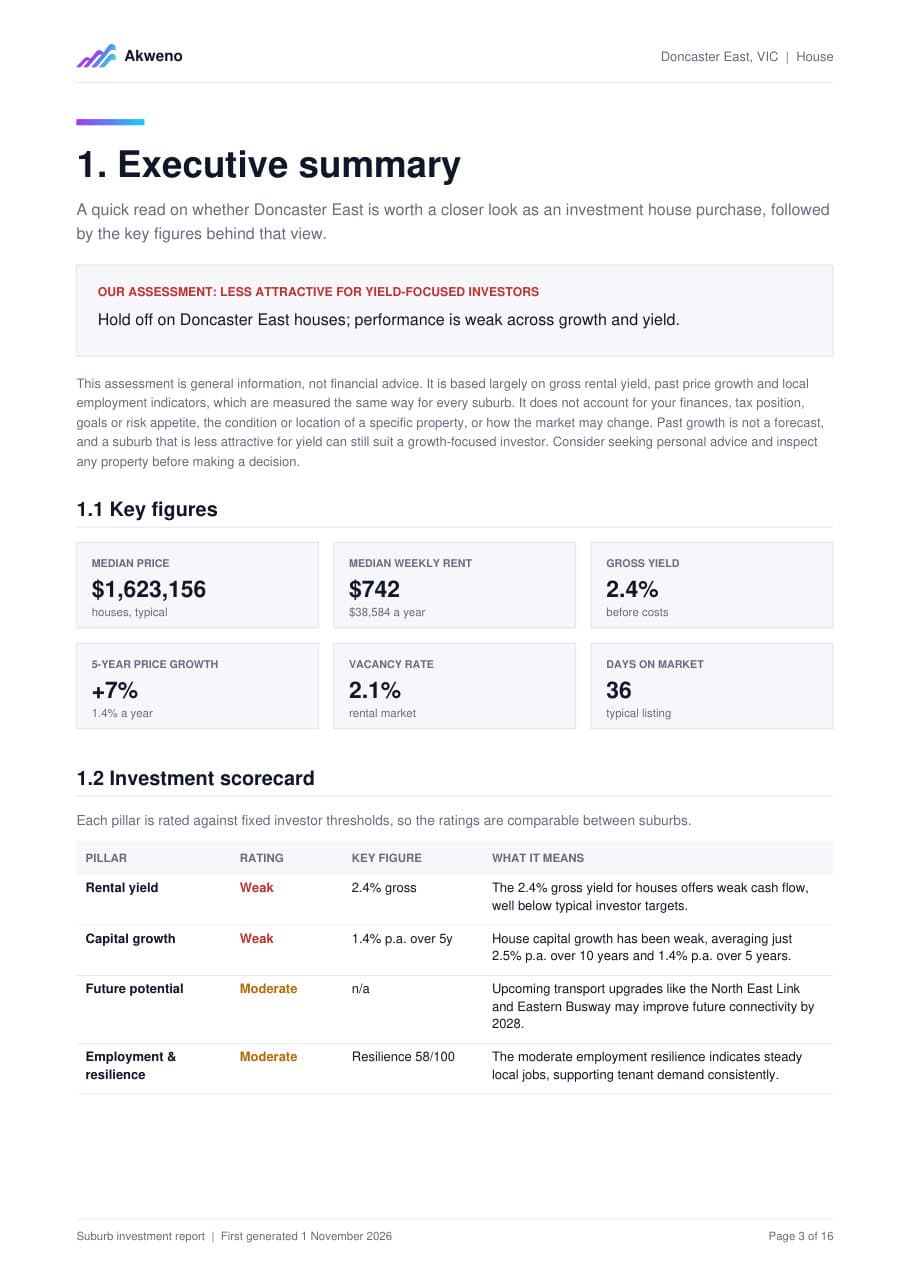
  • Executive summary and investment scorecard for Doncaster EastExecutive summary
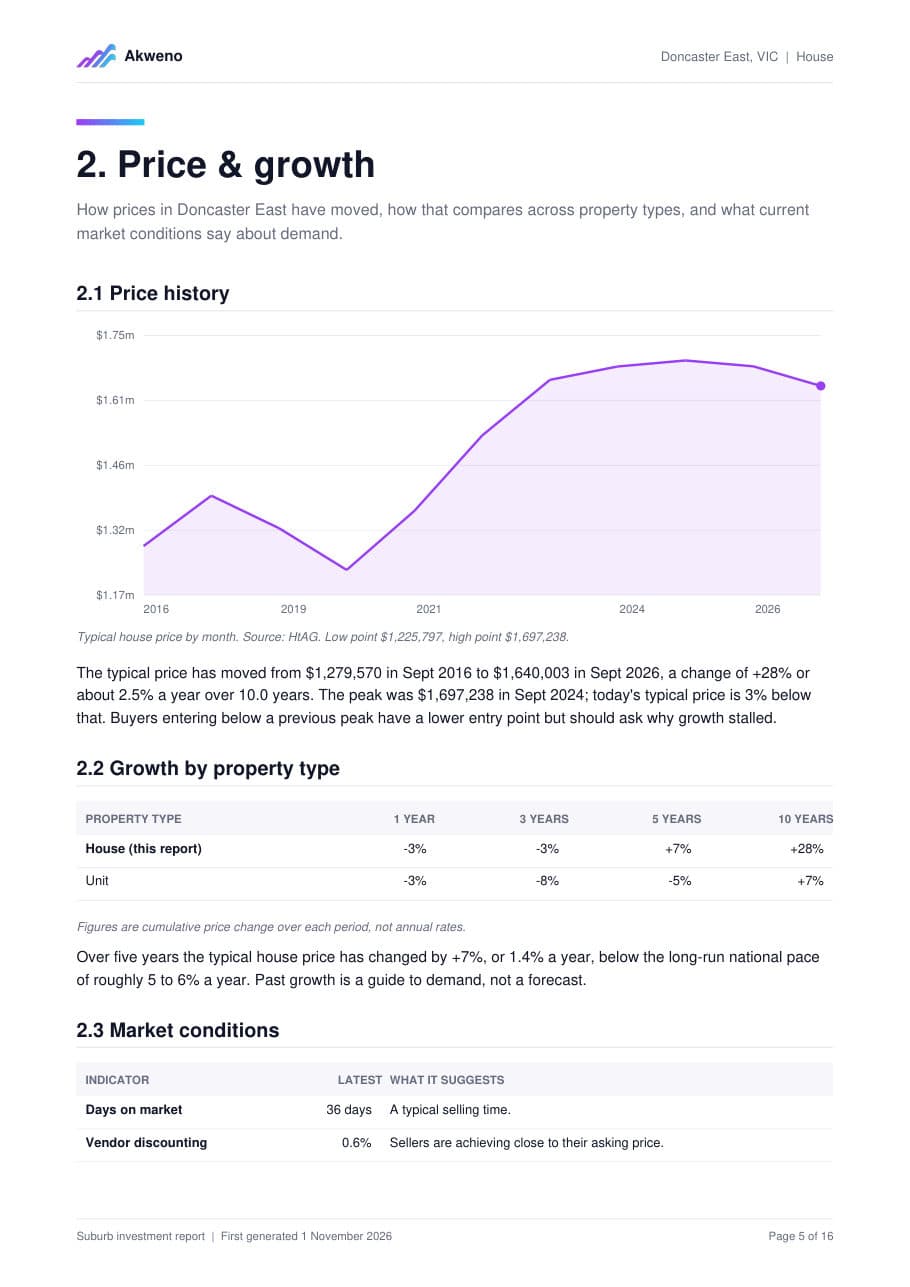
  • Price and growth section with a price history chartPrice & growth
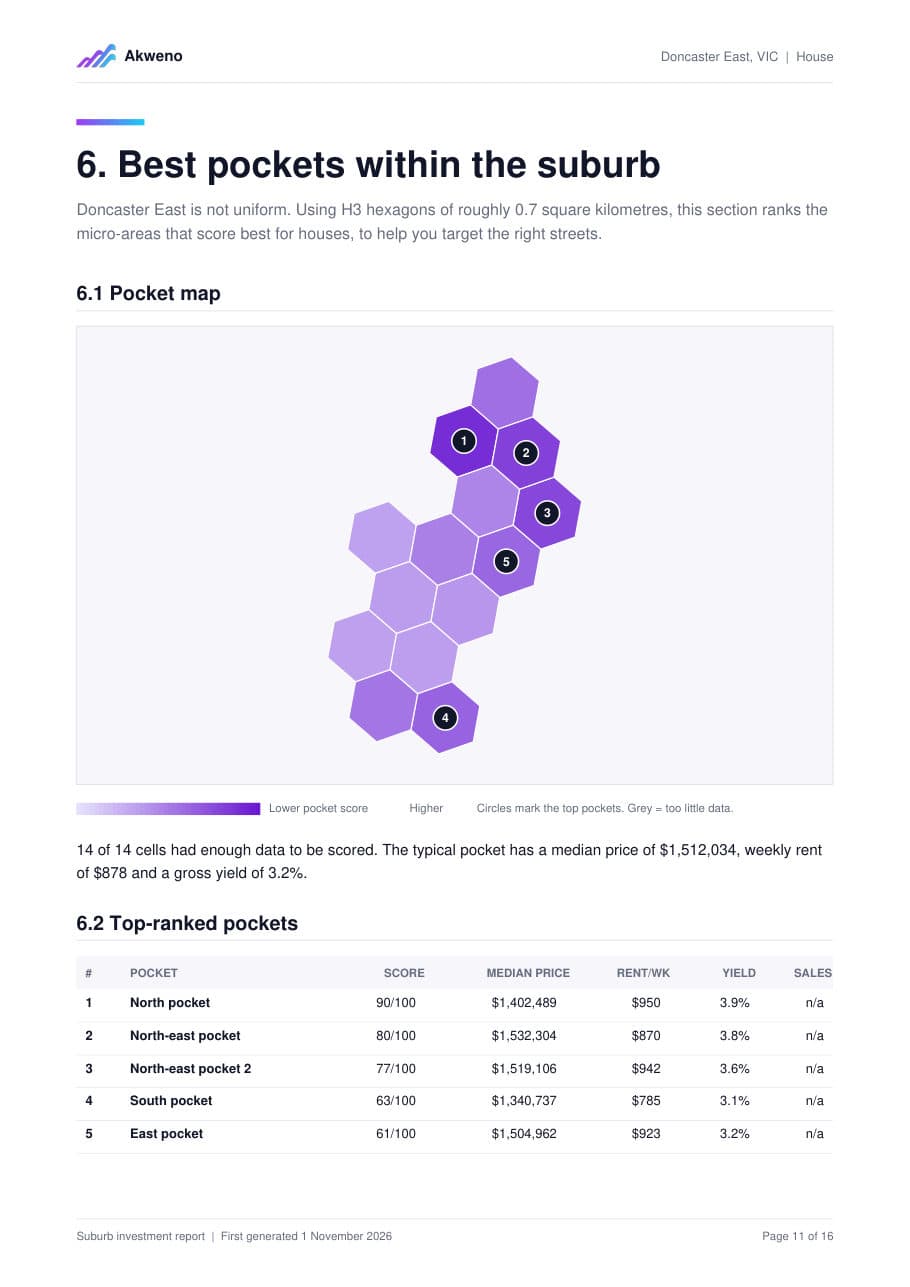
  • Best pockets within the suburb, shown on a hexagon mapBest pockets

A real report generated by Akweno. General information only, not financial advice. No signup required.

Inside the report

What a Australia suburb report covers

The same section order every time, so you can compare one area with another.

Executive summary and scorecard

Key figures, a rated scorecard for rental yield, capital growth, future potential and employment resilience, and our own assessment of how the suburb looks for yield-focused investors.

Price and growth

House and unit price history, growth over one, three, five and ten years, days on market and vendor discounting, so you can see momentum as well as the headline price.

Rental market

Median weekly rent, gross yield, vacancy, and yield by bedroom count, to show whether the rent supports the price you would be paying.

Housing and what to buy

The mix of homes in the suburb and which property type and size the data favours, with median price, rent and yield for each.

Neighbourhood

Who lives there, nearby schools with their ACARA advantage index, transport, parks and a walkability score.

Best pockets within the suburb

A hexagon map that splits a suburb into areas of roughly 0.7 square kilometres and ranks them on yield, price and risk, with the streets and landmarks each pocket sits around.

Better nearby suburbs

Suburbs within 10 km that beat this one on yield or five-year growth, so you can see what you give up or gain by looking next door.

Business and employment

Unemployment, how diverse the local industries are and how much work is in defensive sectors, summarised as a labour resilience score.

Data sources

Where the Australia data comes from

Public and licensed datasets, named in every report along with their limits.

Australia research datasets and their sources
DatasetWhat it covers
Prices, rents, yields and market indicatorsHtAG AnalyticsMedian prices and rents, price history, vacancy, days on market, auction and stock indicators, and H3 pocket data.
Census of Population and HousingAustralian Bureau of StatisticsDemographics, household income, tenure and housing mix.
Labour marketJobs and Skills Australia and ABSSmall Area Labour Markets unemployment and jobs by industry, used for the labour resilience score.
School advantage indexACARAICSEA values for nearby schools. This is a measure of student advantage, not of teaching quality.
Local contextPublic web pages and Google Maps PlatformWritten context on infrastructure and the area, and street and landmark names for pockets.

Method

How the research is built

Fixed thresholds, not a black box
Rental yield, capital growth and employment are each rated against published thresholds, for example a gross yield of 5.5% or more is rated strong and under 4% weak. The same rules apply to every suburb, so ratings are comparable.
Our assessment is general information
The assessment reads the scorecard in plain English. It is not personal advice and it never guarantees a result. A suburb rated less attractive for yield may still suit a growth-focused investor.
Pockets are a screen, not a street guide
Pockets help you narrow where to look inside a suburb. They are built from small-area data and should be followed by a look at the actual street and property.
Saved reports re-open from stored data
A report is saved to your account when you run it. Re-opening or comparing it uses that stored copy rather than fetching the data again.

FAQ

Australia research questions

What does an Australian suburb report cost?

Reports are included with an Akweno plan with a monthly allowance, and re-opening a saved report does not use another credit. The sample report is free to preview and download with no signup.

Which suburbs can I research?

Australian suburbs where we hold enough data for a house or unit report. If a suburb has too little sales or rental data, some sections will show as not available.

Is the report financial advice?

No. It is general information built from public and licensed data. It does not consider your objectives or finances, and past growth is not a forecast. Check the details of any property independently before you buy.

What is a pocket?

A pocket is a small area inside a suburb, about 0.7 square kilometres. Akweno ranks the pockets on yield, price and risk so you know where inside the suburb to start looking.

Can I turn a report into an investment scenario?

Yes. From a saved report you can start a Buy scenario with the suburb figures filled in, then add your deposit, loan and costs to see the cash flow.

SEE MORE. DECIDE AHEAD. BUILD WEALTH.

Turn Australia research into an investment case

Open a report, shortlist the areas that stand out, then test the purchase against your own finances.

7 days free · No card required