
The investment numbers
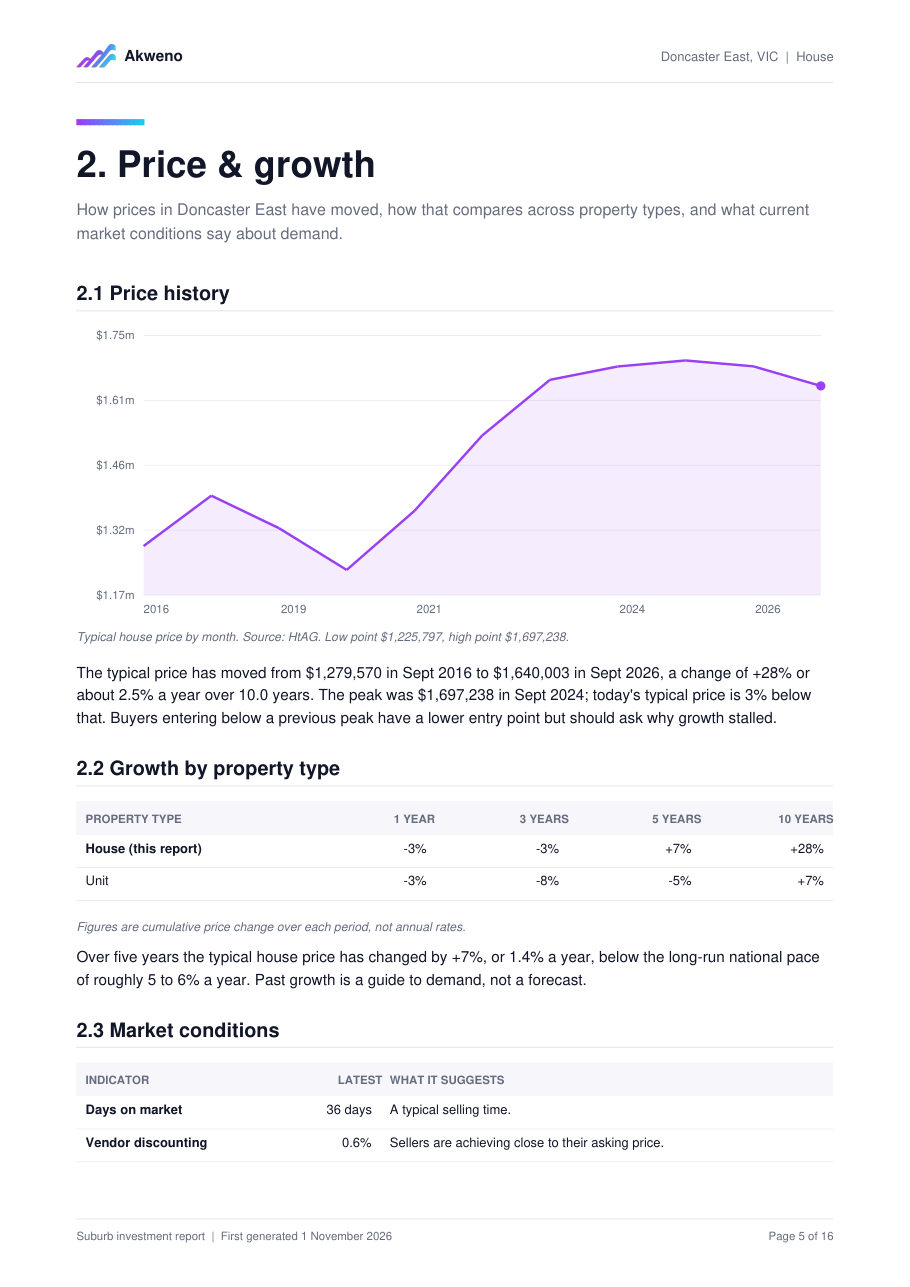
Know what you would pay, what it rents for and how the price has moved.
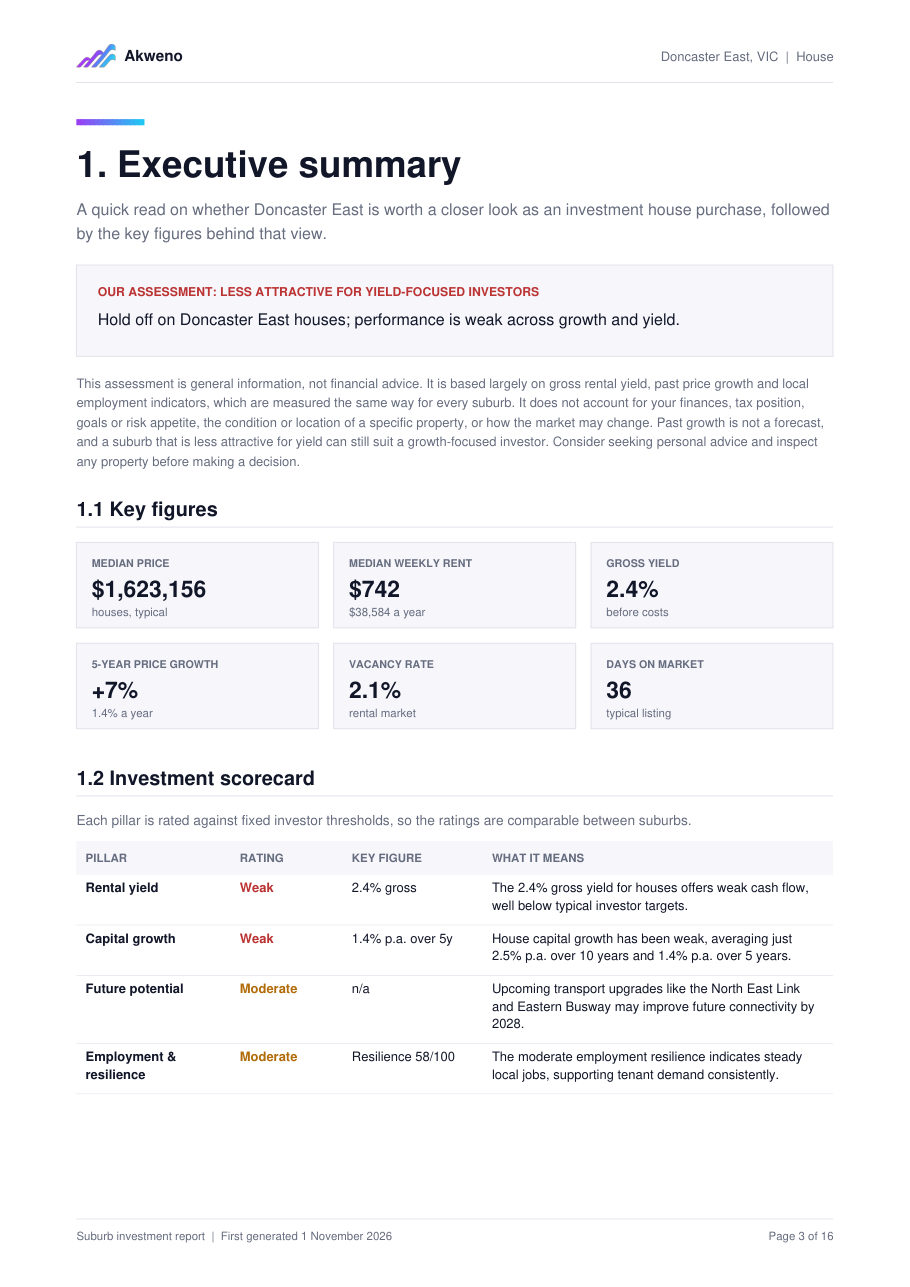
- Rental yield
- Median property price and rent
- Capital growth over 1, 3, 5 and 10 years
- Vacancy, sales volumes and market depth
Akweno Research
Akweno brings the numbers that matter to an investor together in one report for any area, then carries them straight into a Buy scenario so the research ends in a decision.
What you get
Each Akweno report brings the numbers, the area, the best pockets and the alternatives next door into a single document.
Know what you would pay, what it rents for and how the price has moved.
See what it is like to live, rent and own there before you visit.
A suburb or district is not one market. Pockets show where inside it the numbers are strongest.
Compare with the next suburb or district along before you commit to one.
Saved reports re-open at no extra cost.
Scans
Scan a location and radius, or a whole region, and Akweno ranks the suburbs or districts by the yield and growth you want. Then open a full report on the standouts.
Choose your market
Each market has its own data sources, report and free sample, so each has its own research page.
How Akweno Research works
Search locations and compare investment opportunities.
Explore detailed reports, opportunities and risks.
Build an investment scenario using your research.
Research to investment decision
Your research flows into the same place you model purchases and track what you own.
A saved area report holds the prices, rents and yield for the location.
Start a purchase from the report with the area figures already filled in.
How scenarios workAdd your deposit, loan type, rate and purchase costs.
See the weekly or monthly result after rent, interest and running costs.
Cash flow calculatorSee what the purchase does to your existing properties, debt and equity.
Portfolio summaryReports are general information built from public and licensed data. They are not financial advice or a forecast, and area averages do not describe a specific property.
SEE MORE. DECIDE AHEAD. BUILD WEALTH.
Search by yield and growth, open detailed reports and test the purchase, before you book a single inspection.
7 days free · No card required